
Labour variance: billed vs actual hours
Read the Labour Variance dashboard card — billed hours vs logged hours, recovery %, and leakage.
Labour variance answers one question: are you billing the hours you actually work? It lives as a card on the Dashboard, not on the Timesheets page.
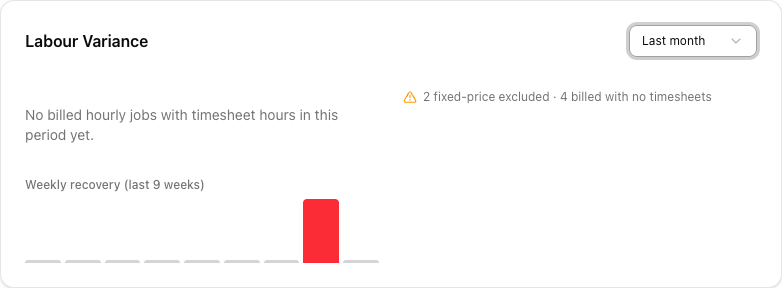
What it compares
- Billed hours — the crew hours you charged for: the hourly (
/hr) lines on billed jobs, multiplied by the crew size (FTE) on each line. - Logged hours — the hours on your timesheets for those jobs.
Recovery % is billed ÷ logged × 100. At 100% you billed exactly what you logged. Below 100% you worked more than you charged — that gap is money left on the table.
"Billed" means a job with status Completed, Invoiced, or Paid. A job still in progress does not count yet. So the card is about finished work, and it settles as jobs complete.
What you'll see
- A period selector: This week, Last week, This month, Last month.
- The headline recovery figure, and a line like "Billed Xh of Yh logged (±Zh) across N jobs".
- An estimate of dollars worked but not billed — the leakage.
- A Weekly recovery (last 9 weeks) mini chart, colour-banded (green near 100%, red when it drifts).
- A Largest variances list — the worst individual jobs.
The data-quality flags matter
The flags along the top are not clutter — they tell you what the number is ignoring:
- "N fixed-price excluded" — fixed-price jobs are not in the calculation (they have no hourly billing to compare).
- "N billed with no timesheets" — jobs you billed but logged no hours against. These silently distort recovery, and usually mean crew hours never got recorded.
- A missing-FTE warning — hourly lines with no crew size set, which understates billed hours.
A great-looking recovery % with "4 billed with no timesheets" underneath is not a great result — it is an incomplete one.
When the card is empty
If it reads "No billed hourly jobs with timesheet hours in this period yet", there is simply nothing to compare in that window — no completed hourly jobs that also have timesheet hours. Widen the period, or check that your completed jobs have both hourly billing lines and logged timesheets.
Tutorial: find where you're losing labour
Recovery feels low and you want to know why.
On the Dashboard, find Labour Variance and set the period to Last month — a full month gives a truer picture than a quiet week.
Look at the top flags first. "N billed with no timesheets" is the one that most often explains a strange figure — those jobs bill hours you never logged, so recovery is being computed on incomplete data. Fix the timesheets and the number becomes trustworthy.
Below 100% means you worked more than you billed. A month at 80% recovery is 20% of your crew's time given away — across a fleet, that is real money.
The Weekly recovery (last 9 weeks) bars show whether this is a one-off or a pattern. A steadily-red run is a pricing or estimating problem, not a bad week.
The Largest variances list names the worst jobs. Open one: did the crew stay hours past the quote? Was the job under-scoped? These specific jobs are where the lesson is.
Remember fixed-price jobs are excluded — the flag says so. Their profitability is a different question. This card is only about hourly work, where billed and logged hours should match.
The single highest-value fix is usually "billed with no timesheets". Make sure completed jobs generate crew hours — see auto-created timesheets — so the card is measuring reality, not gaps.